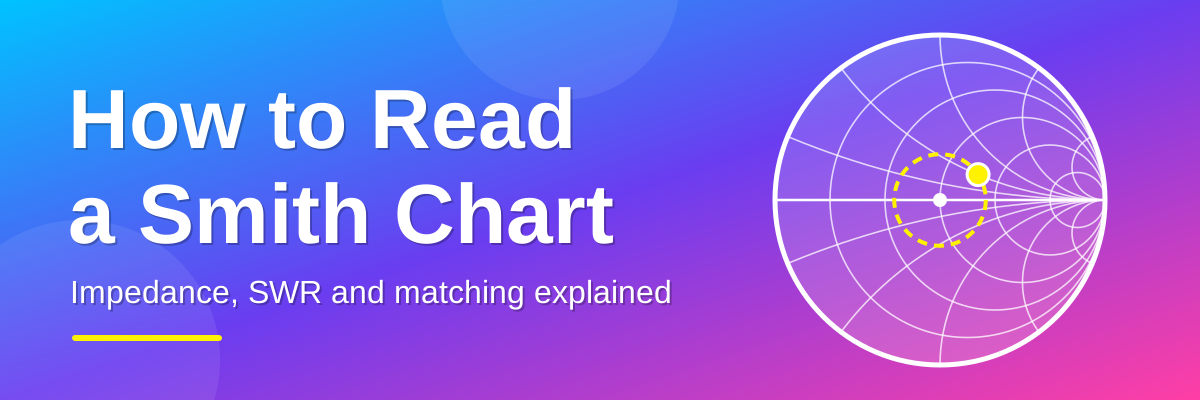
A Smith chart is a graph that shows the impedance of an antenna or any other RF load. It is the default display on a NanoVNA and most antenna analysers. This guide explains what the chart shows, how to find a value on it, and how to use it to read SWR and fix a mismatch. It ends with two worked examples: checking a wire antenna and choosing the right matching transformer for an end-fed wire.
Quick reference
If you already have a reading, this table tells you what it means and what to do. The rest of the post explains why.
| Where the point or trace is | What it means | What to do |
|---|---|---|
| Near the centre | Good match, low SWR | Nothing needed |
| On the horizontal line, right of centre | Resistance above 50 ohms, no reactance | Use a matching network or transformer that steps the impedance down |
| On the horizontal line, left of centre | Resistance below 50 ohms, no reactance | Use a matching network that steps the impedance up |
| Upper half | Inductive. The antenna is too long, or you are measuring above its resonant frequency | Shorten the antenna, or add series capacitance |
| Lower half | Capacitive. The antenna is too short, or you are measuring below its resonant frequency | Lengthen the antenna, or add series inductance |
| Near the outer edge | Poor match. Most of the power is reflected | Check connections, cable and antenna first |
Look out for the grey boxes. A Newcomer tip explains the basics. A Pro note goes deeper. A Try it yourself box lets you practise at Beginner or Advanced level. Click "Show the answer" to check your result.
Step 1: Know what impedance is
Impedance has two parts:
- Resistance (R) is measured in ohms. For a good match to a 50 ohm radio, you want this to be 50.
- Reactance (X) is also in ohms and is written with a "j", like j25 or -j25. You want this to be 0. A positive value (+j) is inductive. A negative value (-j) is capacitive.
An impedance is written as R plus or minus jX. For example, 75 + j25 means 75 ohms of resistance and 25 ohms of inductive reactance. The ideal result for a 50 ohm system is 50 + j0.
The Smith chart plots both numbers at once as a single point.
Newcomer tip
You do not need to do any sums yourself. Your analyser works out the resistance and reactance for you. The Smith chart is just a way of drawing those two numbers as a single point on a picture.
Step 2: Understand the numbers on the chart
The numbers printed on a Smith chart are not in ohms. They are divided by 50, so they are multiples of 50 ohms. This is called normalising.
| Chart number | Real value |
|---|---|
| 0.5 | 25 ohms |
| 1 | 50 ohms |
| 2 | 100 ohms |
| 5 | 250 ohms |
To convert your own impedance, divide both the resistance and the reactance by 50. So 75 + j25 becomes 1.5 + j0.5.
Step 3: Learn the layout

| Where on the chart | What it means |
|---|---|
| Centre | Perfect match. 50 ohms, no reactance, SWR 1:1. |
| Far left | Short circuit (0 ohms). |
| Far right | Open circuit (infinite resistance). |
| Upper half | Inductive (+jX). The antenna is electrically too long, or you are measuring above its resonant frequency. |
| Lower half | Capacitive (-jX). The antenna is electrically too short, or you are measuring below its resonant frequency. |
| Horizontal line through the middle | Zero reactance. Any point on this line is purely resistive. |
The closer a point is to the centre, the better the match. The closer it is to the outer edge, the worse the match.
Pro note
The distance of a point from the centre is the size of the reflection coefficient, written |Γ|. At the centre it is 0 (nothing is reflected). At the outer edge it is 1 (everything is reflected). The angle of the point around the chart is the phase of the reflection.
Step 4: Read the circles and arcs
The grid is made of two sets of lines:
- Circles show resistance. Each circle has one value of resistance all the way round it. The value is printed where the circle crosses the horizontal line. The circle that passes through the centre is 1 (50 ohms).
- Arcs show reactance. Each arc has one value of reactance along its length. The values are printed around the outer edge. Arcs in the upper half are positive (inductive). Arcs in the lower half are negative (capacitive).
To plot an impedance, find the circle for the resistance and the arc for the reactance. The point where they cross is your impedance.
Try it yourself: Beginner
Plot 100 + j0 ohms on a 50 ohm system. Divide by 50 first. Where does the point sit on the chart?
Show the answer
100 ÷ 50 = 2, so the point is 2 + j0. It sits on the horizontal line at the 2 mark, to the right of the centre. There is no reactance, so it is purely resistive.
Step 5: Worked example
We will use this reading as the example: an analyser shows an antenna at 75 + j25 ohms on a 50 ohm system.
What does that sentence mean?
| Part of the sentence | What it means | In plain English |
|---|---|---|
| An analyser | An antenna analyser or NanoVNA. It sends a small RF signal into the antenna and measures what comes back. | The meter that gives you the numbers. |
| 75 | The resistance (R), in ohms. This is the useful part of the load. Power sent into it is either radiated as radio waves or turned into heat. | The part that uses the power. |
| + j25 | The reactance (X), in ohms. The "j" marks it as reactance, which stores energy instead of using it. Engineers write j instead of i because i is already used for current. A plus sign means inductive (it behaves like a coil). A minus sign means capacitive. | An unwanted extra that makes the match worse. Here it is 25 ohms of coil-like reactance. |
| ohms | The unit for resistance and reactance. | |
| On a 50 ohm system | The radio, the coax and the analyser are all designed for 50 ohms. This is the reference value the antenna is judged against. | The target. A perfect antenna would read 50 + j0. |
What is the reading telling us?
- The resistance is 75 ohms, not 50, and the reactance is 25 ohms, not 0. The antenna is not a perfect match.
- Because of the mismatch, some of the signal is reflected back towards the radio. The SWR works out at about 1.8:1. That means about 8% of the power is reflected and about 92% reaches the antenna. This is fine for most radios, which are usually happy up to about 2:1.
- The reactance is positive (+j), so the antenna is slightly inductive. It is a little too long, or you are measuring just above its resonant frequency.
- The aim is to get the reading closer to 50 + j0. The Smith chart shows where the reading sits and which way to move it.
For the technically minded: an impedance written as R + jX is a complex number, Z. The reflection coefficient is Γ = (Z − Z0) ÷ (Z + Z0), where Z0 is the 50 ohm reference. For 75 + j25 this gives a magnitude of about 0.28. SWR is (1 + |Γ|) ÷ (1 − |Γ|), which is about 1.77, and the return loss is about 11 dB. A Smith chart is simply a plot of Γ, drawn so that you can read resistance and reactance off the grid.
Now we plot it on the chart:
- Divide by 50 to normalise: 75 ÷ 50 = 1.5 and 25 ÷ 50 = 0.5. The point is 1.5 + j0.5.
- Find the circle for 1.5. It crosses the horizontal line just to the right of the centre.
- Find the arc for +0.5. It is in the upper half of the chart.
- Mark the point where that circle and that arc cross. This is point A in the picture below.
- The point is in the upper half, so the antenna is slightly inductive. It is a little too long, or you are measuring just above its resonant frequency.
Step 6: Find the SWR

- Draw a circle centred on the middle of the chart that passes through your point. This is the SWR circle (the dashed red circle in the picture).
- Look at where the circle crosses the horizontal line on the right-hand side.
- Read the resistance value at that crossing. That number is the SWR.
For our example the circle crosses at about 1.8, so the SWR is about 1.8:1. A smaller circle means a lower SWR. A circle that reaches the outer edge means a very high SWR.
What does the SWR mean in practice?
SWR tells you how much of the transmitted power is reflected back from the antenna. This table gives some common values.
| SWR | Power reflected | Return loss |
|---|---|---|
| 1.2:1 | about 1% | about 21 dB |
| 1.5:1 | 4% | about 14 dB |
| 2:1 | 11% | about 9.5 dB |
| 3:1 | 25% | 6 dB |
| 5:1 | 44% | about 3.5 dB |
Newcomer tip
SWR only tells you how well the antenna matches the radio. It does not tell you how well the antenna radiates. A dummy load has a perfect SWR and radiates nothing.
Try it yourself: Beginner
A point sits on the horizontal line at the 3 mark, to the right of the centre. What is the SWR?
Show the answer
The SWR circle through that point crosses the right-hand side of the horizontal line at the same place, so the SWR is 3:1. On a 50 ohm system the point is 150 ohms.
Try it yourself: Advanced
Calculate the SWR for 50 + j50 ohms without using the chart. Use Γ = (Z − Z0) ÷ (Z + Z0).
Show the answer
Z − Z0 = j50 and Z + Z0 = 100 + j50. The magnitude of j50 is 50. The magnitude of 100 + j50 is the square root of (100² + 50²), which is the square root of 12500, or 111.8. So |Γ| = 50 ÷ 111.8 = 0.447. SWR = (1 + 0.447) ÷ (1 − 0.447) = 2.62:1.
Step 7: Understand what cable length does
The outer edge of the chart has a scale in wavelengths. It shows what happens when you add or remove cable between the analyser and the antenna.
- Adding cable moves the point clockwise around the SWR circle. This is moving towards the radio.
- Removing cable moves the point anticlockwise. This is moving towards the antenna.
- One full lap of the chart is half a wavelength of cable.
The SWR stays the same (ignoring cable loss) because the point stays on the same circle. But the resistance and reactance change. In our example, 0.1 of a wavelength of coax moves the point from 75 + j25 to about 72 - j27 ohms (point B in the picture). The antenna has not changed, but the impedance you measure at the radio end looks different.
This is why it is best to calibrate your analyser at the antenna end of the cable if you want to see the true impedance of the antenna.
Pro note
Real cable has loss, so the point does not stay on exactly the same circle. It spirals slowly towards the centre as the cable gets longer. A long run of lossy coax can therefore make an antenna look better matched than it really is. The wavelength scale also refers to wavelength inside the cable, which is shorter than in free air by the cable's velocity factor (about 0.66 for solid polyethylene coax such as RG-58).
Try it yourself: Beginner
You add some cable between the analyser and the antenna. Which way does the point move round the chart, and what happens to the SWR?
Show the answer
The point moves clockwise round the SWR circle, towards the radio. The SWR stays the same (ignoring cable loss), but the resistance and reactance readings change.
Try it yourself: Advanced
A purely resistive load of 100 ohms is connected to a quarter wavelength of 50 ohm coax. What impedance does the analyser see at the other end?
Show the answer
A quarter wavelength is half a lap of the chart, so the point moves to the opposite side of the centre: from 2 + j0 to 0.5 + j0, which is 25 ohms. The sums agree: 50 × 50 ÷ 100 = 25 ohms. The SWR is still 2:1 because the point stays on the same circle (ignoring cable loss and velocity factor).
Step 8: Use the chart to fix a mismatch

To match an antenna you need to move the point to the centre. Adding a component moves the point in a set direction:
- A series inductor moves the point clockwise along its resistance circle (upwards).
- A series capacitor moves the point anticlockwise along its resistance circle (downwards).
- Shunt (parallel) components work the same way but on a different set of circles, which are the same chart turned around by half a turn.
In the picture, the start point is 1 + j1 (50 + j50 ohms). A series capacitor of the right size cancels the +j50 and moves the point straight to the centre. That is a perfect match. Most real matching networks, such as an L-network, use two moves like this: the first moves the point onto the 1 circle, and the second slides it to the centre.
Newcomer tip
Always make the antenna itself resonant first by adjusting its length. Only add a matching network afterwards, if the resistance at resonance is still not close to 50 ohms.
Try it yourself: Beginner
A reading of 50 - j50 sits in the lower half of the chart. Do you add a series inductor or a series capacitor to move it to the centre?
Show the answer
A series inductor. The reading is capacitive (-j50). A series inductor adds +j, which moves the point up along its resistance circle to the centre.
Try it yourself: Advanced
What size inductor has +j50 ohms of reactance at 7.1 MHz? And what size capacitor would you need to cancel +j50 instead?
Show the answer
Inductor: L = X ÷ (2πf) = 50 ÷ (2 × π × 7,100,000) = about 1.12 µH. Capacitor: C = 1 ÷ (2πfX) = about 448 pF.
Reading a NanoVNA trace
A NanoVNA does not show a single point. It sweeps across a range of frequencies and draws a line, called a trace, with a point for each frequency. Use these rules to read it:
- Where the trace crosses the horizontal line, reactance is zero. That is the resonant frequency.
- A trace that stays in the upper half means the antenna is too long. Shorten it.
- A trace that stays in the lower half means the antenna is too short. Lengthen it.
- The nearer the trace passes to the centre, the better the match at that frequency.
- A large trace that stays near the outer edge usually means a poor match, a bad connection or a cable fault.
Always calibrate (open, short, load) over the frequency range you are measuring before you start. A bad calibration gives wrong readings.
Example 1: Check a wire antenna with a NanoVNA
A Smith chart can show the impedance of a wire antenna and tell you whether to make it longer or shorter. This example uses a 40 m dipole.
Setup
- Set the sweep to cover the band, for example 6.8 to 7.4 MHz, and choose the Smith chart display.
- Calibrate (open, short, load) on the end of the cable that will connect to the antenna. This puts the reference point at the feedpoint, so the readings show the antenna and not the cable.
- Connect the coax to the dipole feedpoint and the other end to the CH0 port. Fit a balun or choke at the feedpoint. Without one, current on the outside of the coax shield gives wrong readings.
- Run the sweep and put a marker on the frequency you care about, for example 7.1 MHz.
- Read the marker. It shows the resistance, the reactance and the SWR.
A single bare wire has no fixed impedance on its own. The impedance depends on what the wire is fed against, such as the other half of a dipole, a counterpoise or the ground.
Reading the result
Say the marker shows 62 - j18 at 7.1 MHz.
- Divide by 50 to normalise: 62 ÷ 50 = 1.24 and 18 ÷ 50 = 0.36. The point is 1.24 - j0.36.
- The point is just right of the centre and in the lower half. Lower half means capacitive, so the wire is a little too short.
- The SWR is about 1.5:1.
Make each leg of the dipole slightly longer and sweep again. The trace moves up towards the horizontal line and then towards the centre. Keep adjusting until the trace crosses the horizontal line at the frequency you want.
Example 2: Choose the right matching transformer for an end-fed wire
Why an end-fed half-wave needs a transformer
An end-fed half-wave (EFHW) wire is fed at one end. The end of a half-wave wire is a point of high voltage and very low current, and impedance is voltage divided by current. So the impedance at that end is very high, usually somewhere between 2000 and 4000 ohms. A 50 ohm radio cannot drive that directly. A transformer at the feedpoint steps the high impedance down to about 50 ohms.
Transformer ratios
The ratio on a transformer, such as 49:1, is an impedance ratio. Multiply it by 50 to get the impedance it matches.
| Ratio | Matches a wire impedance of about | Notes |
|---|---|---|
| 49:1 | 2450 ohms | The most common starting point |
| 56:1 | 2800 ohms | |
| 64:1 | 3200 ohms | |
| 81:1 | 4050 ohms |
Setup
- Cut the wire to about a half wavelength for the lowest band you want. For 40 m that is roughly 20 m.
- Fit the transformer at the feed end. Add a short counterpoise wire on its ground side and a choke on the coax.
- Hang the wire in the position where it will be used. Height and nearby objects change the impedance, so measure it in place.
- Calibrate the NanoVNA at the transformer's 50 ohm connector and connect the transformer to CH0.
- Sweep the band with the Smith chart display.
Reading the result
The resistance you read on the 50 ohm side is the wire impedance divided by the transformer ratio. Find where the trace crosses the horizontal line and see which side of the centre it is on.
| Where the trace crosses the horizontal line | What it means | What to try |
|---|---|---|
| Right of centre (above 50 ohms) | The wire impedance is higher than the transformer expects | A higher ratio, for example 64:1 instead of 49:1 |
| At or near the centre | The ratio is right | No change |
| Left of centre (below 50 ohms) | The wire impedance is lower than the transformer expects | A lower ratio, for example 36:1 or 42:1 |
For example, if the wire is really 4000 ohms and you use a 49:1 transformer, the analyser reads 4000 ÷ 49, which is about 82 ohms. That is right of centre, so a 64:1 transformer (4000 ÷ 64 = 62.5 ohms) is a better choice.
Also check the frequency. If the crossing is at the wrong frequency, change the wire length. Shortening the wire moves the crossing up in frequency. Lengthening it moves the crossing down.
This method only applies to a half-wave wire. A random length of wire that is not resonant is usually fed with a 9:1 transformer and an antenna tuner instead.
Try it yourself: Beginner
With a 49:1 transformer, an end-fed wire reads 82 ohms where the trace crosses the horizontal line. Is that left or right of centre, and what should you try?
Show the answer
82 ohms is above 50, so it is right of centre. The wire impedance is higher than the transformer expects, so try a higher ratio, such as 64:1.
Try it yourself: Advanced
With a 49:1 transformer the analyser reads 36 ohms at the crossing. What is the wire impedance, and which ratio fits best?
Show the answer
Multiply the reading by the ratio: 36 × 49 = 1764 ohms. Divide by 50 to get the ideal ratio: 1764 ÷ 50 = 35.3, so a 36:1 transformer (1800 ohms) is the closest fit.
Common mistakes
- Not calibrating, or calibrating over the wrong range. Calibrate (open, short, load) across the frequency range you are about to sweep.
- Calibrating at the analyser instead of at the antenna end of the cable. Any cable between the calibration point and the antenna rotates the point round the chart and hides the true impedance.
- No choke at the feedpoint. Current on the outside of the coax makes the cable part of the antenna. The reading then changes when you touch or move the cable.
- Measuring at one frequency only. Sweep the whole band so you can see where the antenna is resonant.
- Measuring in the wrong place. Height and nearby objects change the impedance, so measure with the antenna in its final position.
- Reading the chart numbers as ohms. The numbers are multiples of 50 ohms. A circle labelled 2 is 100 ohms.
- Judging an antenna by SWR alone. A low SWR means a good match. It does not mean a good antenna.
Practice readings
Here are four readings on a 50 ohm system. Work out where each one sits on the chart before you look at the answers in the other columns.
| Reading | Normalised | Where it sits | SWR | What it means |
|---|---|---|---|---|
| 25 + j0 | 0.5 + j0 | On the horizontal line, left of centre | 2.0:1 | Purely resistive. The resistance is half of 50 ohms. |
| 100 + j0 | 2 + j0 | On the horizontal line, right of centre | 2.0:1 | Purely resistive. The resistance is double 50 ohms. |
| 50 + j50 | 1 + j1 | Upper half, on the circle that passes through the centre | 2.6:1 | Inductive. A series capacitor with -j50 ohms of reactance moves it to the centre. |
| 50 - j50 | 1 - j1 | Lower half, on the circle that passes through the centre | 2.6:1 | Capacitive. A series inductor with +j50 ohms of reactance moves it to the centre. |
Summary
- The centre is a perfect 50 ohm match. The further from the centre, the worse the match.
- Upper half is inductive (too long). Lower half is capacitive (too short).
- Circles show resistance. Arcs show reactance.
- Draw a circle centred on the middle through your point. Where it crosses the right-hand side of the horizontal line is the SWR.
- Adding cable turns the point clockwise around that circle.
- A series inductor moves the point up. A series capacitor moves it down.
- To check a wire antenna, calibrate at the feedpoint, sweep the band and read the marker. Lower half means too short. Upper half means too long.
- For an end-fed half-wave, start with a 49:1 transformer. If the trace crosses right of centre, try a higher ratio. If it crosses left of centre, try a lower one.
Frequently asked questions
What does the "j" mean?
It marks the reactance part of an impedance. It is the engineering symbol for the imaginary unit. Engineers use j instead of i because i is used for current.
What is a good SWR?
Below 1.5:1 is very good. Below 2:1 is fine for most radios. The right answer depends on your transmitter, so check its manual.
Does a low SWR mean I have a good antenna?
No. SWR only shows how well the antenna matches the radio. A dummy load has a perfect SWR and does not radiate.
Why does my reading change when I change the cable?
Cable length rotates the point round the chart. Calibrate at the antenna end of the cable, and fit a choke so the outside of the coax does not become part of the antenna.
Why do I need to calibrate?
Calibration removes the effect of the analyser's own cables and connectors, so the reading shows only the antenna.
Can I use a Smith chart for something other than antennas?
Yes. It works for any RF load, including filters, amplifiers and cables.
What if my system is not 50 ohms?
The chart works the same way. Divide by the system impedance instead. For a 75 ohm system, divide by 75, so 75 ohms becomes 1 and the centre is still a perfect match.
Glossary
The terms are grouped from the basics to the more advanced. Everything here is used somewhere in this post.
The basics
| Term | Meaning |
|---|---|
| Ohm | The unit of resistance, reactance and impedance. Written with the symbol Ω. |
| Frequency | How many times per second a signal repeats. Measured in hertz (Hz). 7.1 MHz is 7,100,000 cycles per second. |
| Wavelength | The distance a radio wave travels in one cycle. In free space it is about 300 divided by the frequency in MHz, in metres. |
| Impedance (Z) | The total opposition a circuit or antenna presents to an RF signal. It has a resistance part and a reactance part. Measured in ohms. |
| Resistance (R) | The part of the impedance that uses up power, either by radiating it or by turning it into heat. |
| Reactance (X) | The part of the impedance that stores energy instead of using it. Positive is inductive. Negative is capacitive. |
| j | The symbol that marks the reactance part of an impedance. It is the imaginary unit. Engineers use j instead of i because i is used for current. |
| Inductive | Behaving like a coil. Shown as +jX, in the upper half of the chart. |
| Capacitive | Behaving like a capacitor. Shown as -jX, in the lower half of the chart. |
| Resonance | The frequency where the reactance is zero and the antenna looks purely resistive. |
| Characteristic impedance (Z0) | The impedance the radio, cable and analyser are designed for. Usually 50 ohms. |
| Normalised | Divided by Z0. This is why the chart numbers are multiples of 50 ohms. |
Measuring and matching
| Term | Meaning |
|---|---|
| Smith chart | A graph that plots impedance as a point, with a grid that shows resistance and reactance. |
| VNA | Vector network analyser. An instrument such as the NanoVNA that measures impedance across a range of frequencies. |
| Sweep | Measuring across a range of frequencies, for example the whole 40 m band. |
| Trace | The line the analyser draws to show the measurements across a sweep. |
| Marker | A cursor you place on the trace to read the exact values at one frequency. |
| Calibration (open, short, load) | Measuring three known standards so the analyser can remove errors from its cables and connectors. |
| SWR | Standing wave ratio. A measure of how well the load matches the system. 1:1 is a perfect match. |
| Reflection coefficient (Γ) | The fraction of the signal that is reflected from the load. 0 is no reflection and 1 is total reflection. |
| Return loss | How much weaker the reflected signal is than the signal sent, in dB. A higher number is better. |
| Bandwidth | The range of frequencies over which the SWR stays at an acceptable level. |
| Feedpoint | The place where the feedline connects to the antenna. |
| Feedline | The cable that carries the signal between the radio and the antenna, usually coax. |
| Balun | A device at the feedpoint that connects a balanced antenna, such as a dipole, to unbalanced coax. |
| Choke | A device that stops current flowing on the outside of the coax shield. |
| Counterpoise | A wire that acts as the ground side of an antenna such as an end-fed wire. |
| Transformer ratio | The impedance ratio of a matching transformer, for example 49:1. Multiply it by 50 to get the impedance it matches. |
| EFHW | End-fed half-wave. A wire about half a wavelength long, fed at one end through a high-ratio transformer. |
| ATU | Antenna tuning unit. An adjustable matching network that makes the radio see 50 ohms. It does not change the antenna's own impedance. |
| L-network | A simple matching circuit made of two parts, one in series and one in parallel (shunt). |
Going deeper
| Term | Meaning |
|---|---|
| Mismatch loss | The power lost because of reflection, in dB. At 2:1 SWR it is about 0.5 dB. |
| Standing wave | The pattern of voltage and current along the feedline caused by the forward and reflected signals combining. |
| Electrical length | The length of a cable or antenna measured in wavelengths, taking velocity factor into account. |
| Velocity factor | How much slower a signal travels in a cable than in free air. About 0.66 for solid polyethylene coax. |
| Quarter-wave transformer | A quarter wavelength of line that transforms an impedance. For a line of impedance Zc, the input impedance is Zc² divided by the load impedance. |
| Admittance (Y) | The reciprocal of impedance (1 ÷ Z). Used for parallel (shunt) parts. Measured in siemens. |
| Conductance (G) | The real part of admittance. It is the reciprocal of resistance for a purely resistive load. |
| Susceptance (B) | The imaginary part of admittance. |
| Common-mode current | Current that flows on the outside of the coax shield instead of inside the cable. It makes the coax part of the antenna and upsets measurements. |
| Unun | An unbalanced-to-unbalanced transformer. The 49:1 transformer used on an end-fed wire is technically an unun. |